Brain-Computer Interface
ITR Calculator
ITR Calculator
Information Transfer Rate (ITR):
Information Transfer Rate (ITR) is the standard method for measuring the performance of communication for control systems, especially for Brain-Computer Interfaces. It is the amount of information transferred per unit time.The ITR is usually calculated in bits/min, by using the given formulas 1: $$B\Biggr({Bit \over Trial}\Biggr) = log_2 N + P \times log_2P+(1-P) \times log_2 \Biggl({1-P \over N-1}\Biggr)$$ $$Q\Biggr({Trials \over Min}\Biggr) = {S \over T}$$ where:
B= information transferred in bits per trial,
N= number of targets (for this example the default value of 4 is used),
P= classification accuracy. It is calculated by dividing number of correct command classifications by the total number of classified commands, e.g. for word "BRAIN", spelled as "BURKAIN"; the accuracy, calculated on the letters level (e.g. for a P300 BCI) is: P= 5/7 = 0.7413 = 74.13%
To obtain the ITR in bits/min, B is multiplied by the average classification time in minutes.
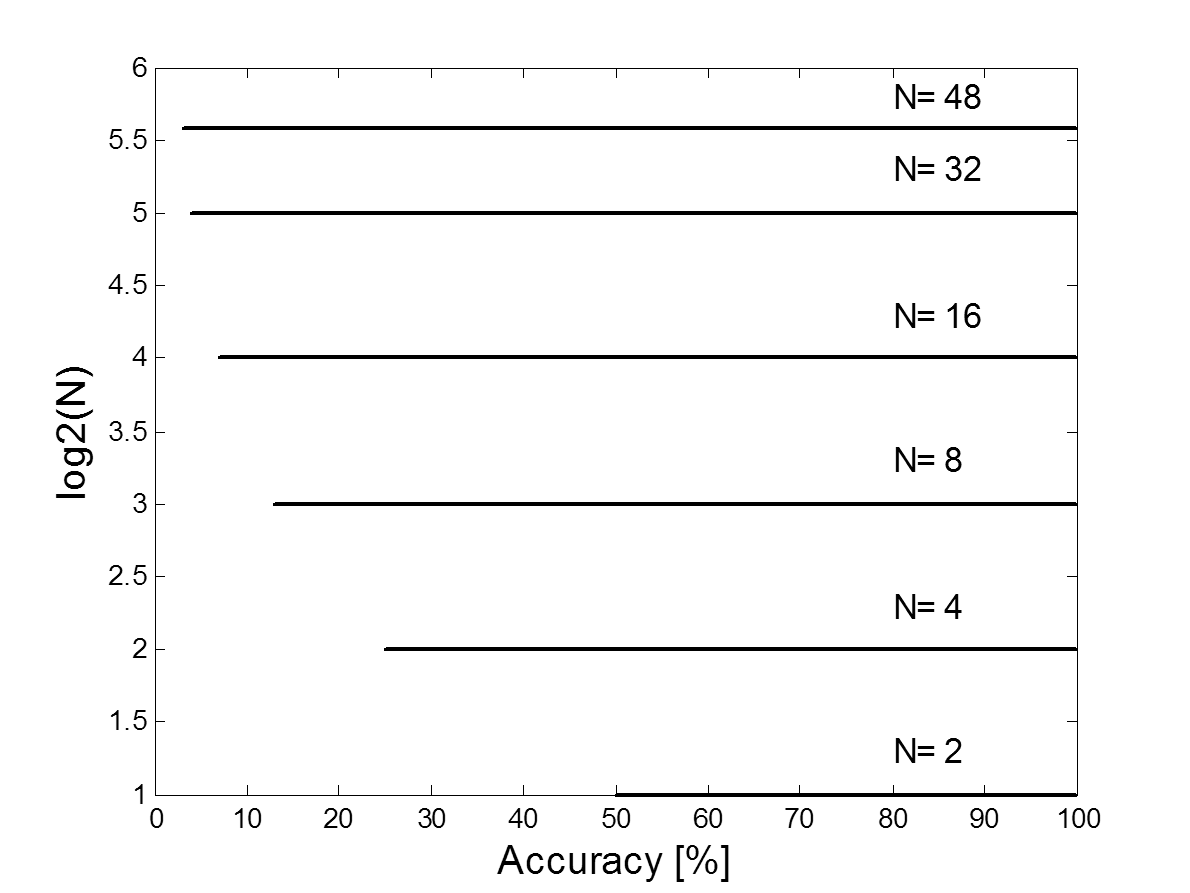
$$ITR\Biggr({Bit \over Min}\Biggr) = B \times Q $$ The following graph shows the log2(N), the first part of the ITR formula for different number of targets (N). This is the only positive summand in this formula and is NOT dependent on the accuracy.
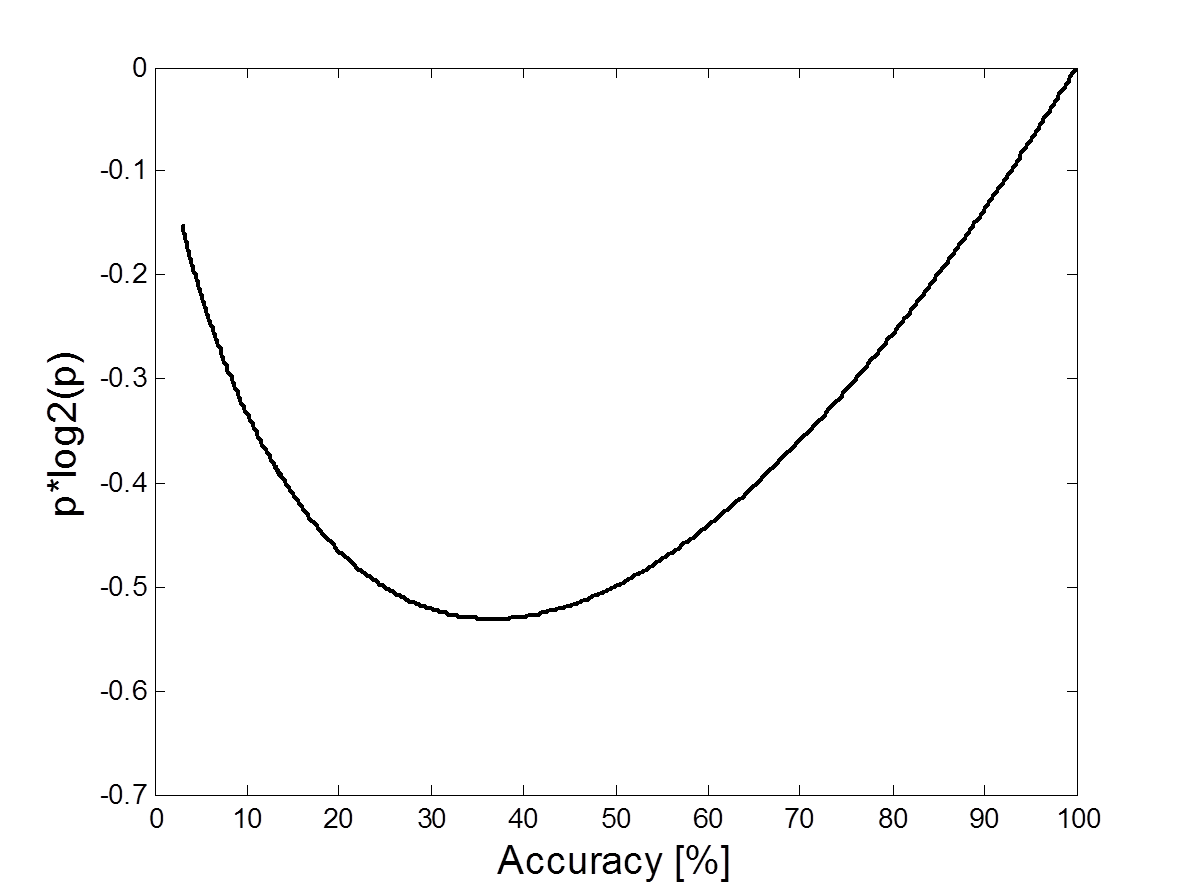
The next graph shows the second term of the ITR formula as a function of the accuracy, P. This summand take into account the classification accuracy and decrease the ITR in case of lower accuracies, all possible values are negative. Please also note that the good range for this summand is only in the region of accuracies over 40%. This was already analyzed e.g. in the paper about utility metric 2.
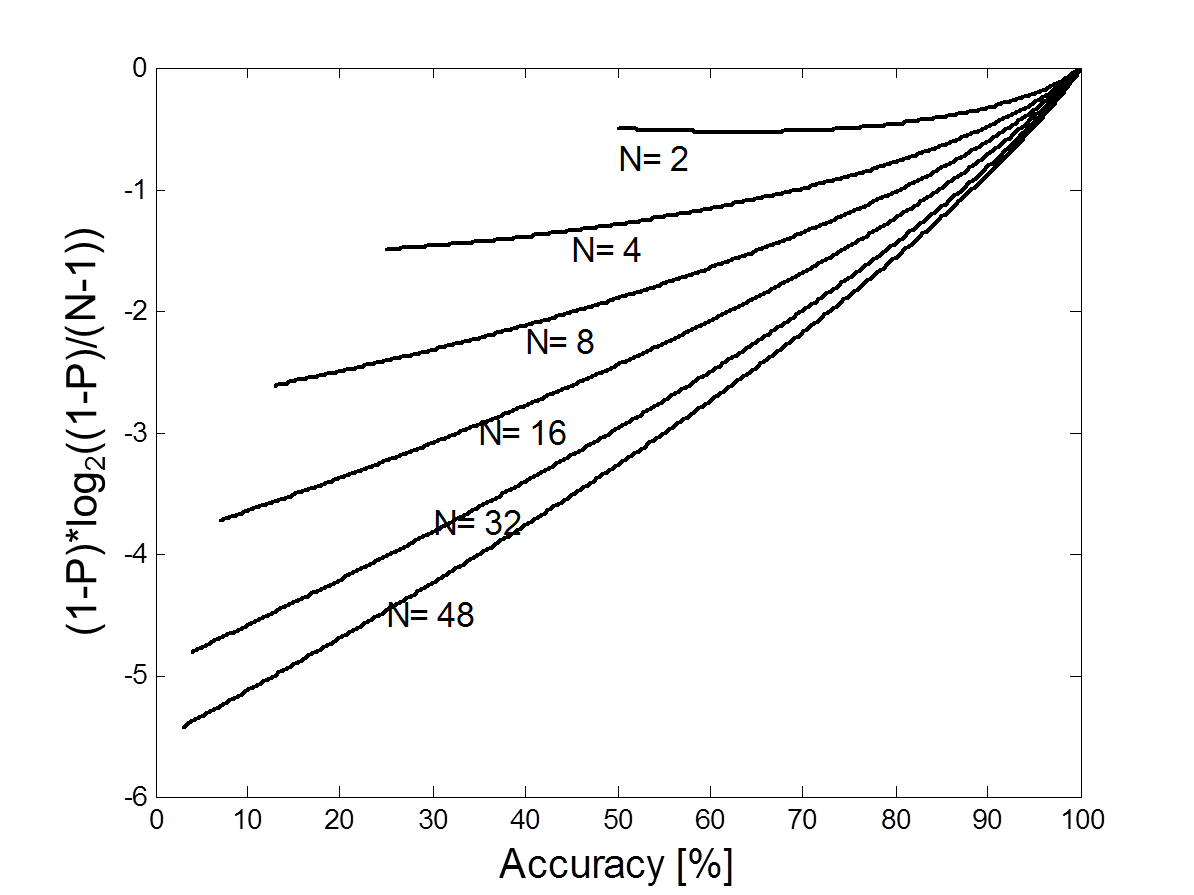
The graph below shows the third term of the ITR formula as a function of the accuracy (P), and number of targets (N). As with the second summand, the values are negative for the accuracies below 100%, for this summand the number of targets is essential.
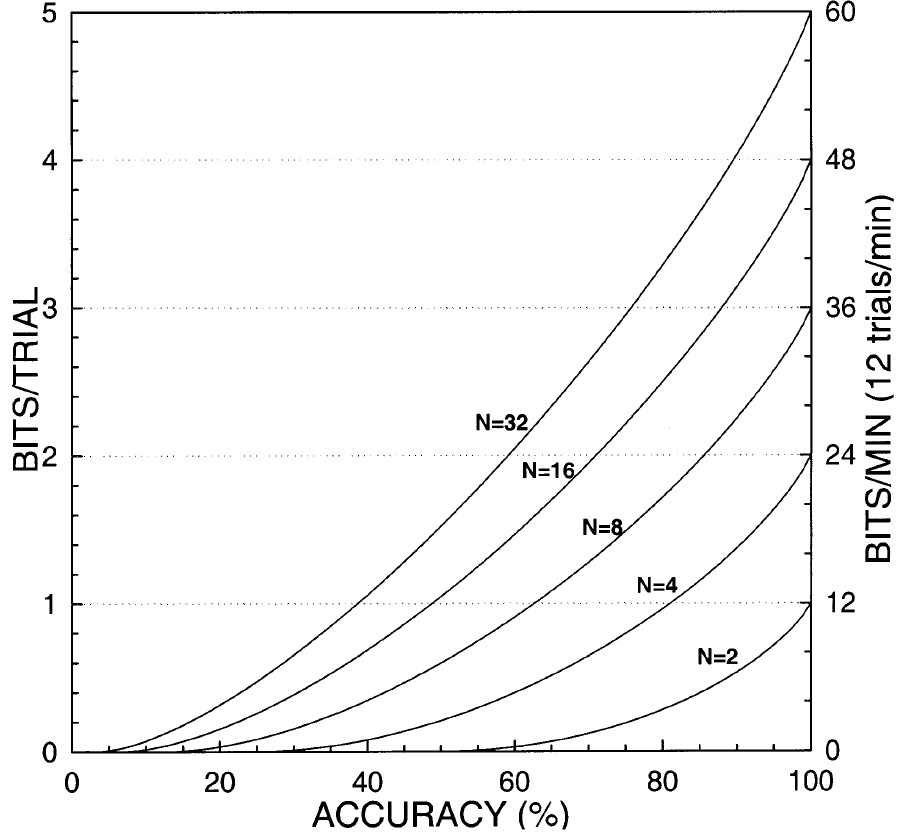
The following graph (Wolpaw et al., 2002) shows the information transfer rate in bits/trial and in bits/minute. The number of possible choices is denoted by N, where the typical values for N are 2, 4, 8, 16, or 32.
Logo - Design - Scripts by Margret Stilke-Volosyak - Lotto Wheels.
1 Wolpaw, Jonathan R., et al. "Brain-computer interfaces for communication and control." Clinical neurophysiology 113.6 (2002): 767-791.
2 Dal Seno, Bernardo, Matteo Matteucci, and Luca T. Mainardi. "The utility metric: a novel method to assess the overall performance of discrete brain-computer interfaces." IEEE Transactions on Neural Systems and Rehabilitation Engineering 18.1 (2010): 20-28.